Here's the latest note on the job market from the AEA's Committee on the Job Market. It reflects a tight job market (but may also reflect that fewer than 100% of available jobs are published in the JOE, and this may be in flux). The full memo is at the link below, and I'm summarizing here some of the highlights (trigger warning:(
JOE Job Openings by Sector, 2023 versus the past 4 years
"To: Members of the American Economic Association
From: AEA Committee on the Job Market: John Cawley (chair), Matt Gentzkow, Brooke Helppie-McFall, Al Roth, Peter Rousseau, and Wendy Stock Date: December 8, 2023
This memo reports the cumulative number of unique job openings on Job Openings for Economists (JOE), by sector and week, compared to the same week in recent years.
Some clarifications on the data and graphs in this memo:
• ...
• The data described in this memo cover ISO weeks 1 through 48, which in 2023 ended December 3.
• The counts that are graphed and discussed are the number of job openings. To clarify, it is not the number of job listings; a listing may include multiple openings.
• ...
• On each graph, the year-to-date cumulative number of job openings is listed for the past five years separately: 2019-2023. The graphs are shown below, overall and by sector.
Figure 1 (on p. 3) shows the total number of job openings in 2023, compared to recent years. As of the end of week 48, there have been 2,924 jobs listed on JOE since the beginning of 2023, which is 14.7% lower than at the same week in 2022, 8.7% lower than the same week in 2021, 21.9% higher than the same week in 2020 (the worst COVID year), and 15.9% lower than the same week in 2019, the last pre- COVID year.
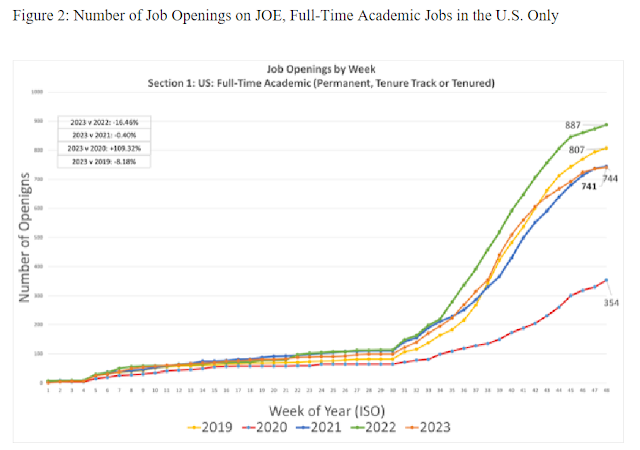
Subsequent graphs compare the number of job openings separately by sector. Figure 2 shows that 741 full-time academic positions in the U.S. have been listed on JOE so far in 2023; this is 16.5% lower than at the same week in 2022, 0.4% lower than at the same week in 2021, 109.3% higher than at the same week in 2020, and 8.2% lower than the same week in 2019 - see p. 4.
Figure 4 shows that 949 full-time academic job openings in institutions outside the U.S. have been listed on JOE so far in 2023; that is 7.2% lower than at the same week in 2022, 9.5% lower than the same week in 2021, 11.1% higher than at the same week in 2020, and 16.7% lower than the same week in 2019 - see p. 6.
Figure 6 shows that 508 full-time non-academic positions (in the U.S. or abroad) have been listed on JOE so far in 2023; that is 26.8% lower than at the same week in 2022, 30.0% lower than at the same week in 2021, 18.2% lower than the same time in 2020 and 35.4% lower than the same week in 2019 - see p. 8.
Over the past four years, roughly 92% of the calendar year’s job listings have been posted by the end of November. In January 2024, we will post a year-end report that includes the final numbers for 2023.
The AEA Executive Committee and the Committee on the Job Market provide the following guidance for the job market, to ensure common expectations, fairness, and a thick job market. This guidance concerns the timing of interview invitations, the interviews themselves, and exploding job offers.
...

 |


No comments:
Post a Comment